How to Choose Food Solutions for Global Buyers in 2026?
In 2026, global food purchasing will demand more than attractive pricing. Buyers will compare food solutions through safety, traceability, nutrition, resilience, and measurable value. A carton may look competitive until temperature records, import documents, and shelf-life losses enter the calculation. Small details matter. Supplier evidence should include ingredient specifications, allergen controls, batch records, and clear country-of-origin information. Independent audits and laboratory testing can strengthen confidence, but they cannot replace careful buyer verification.
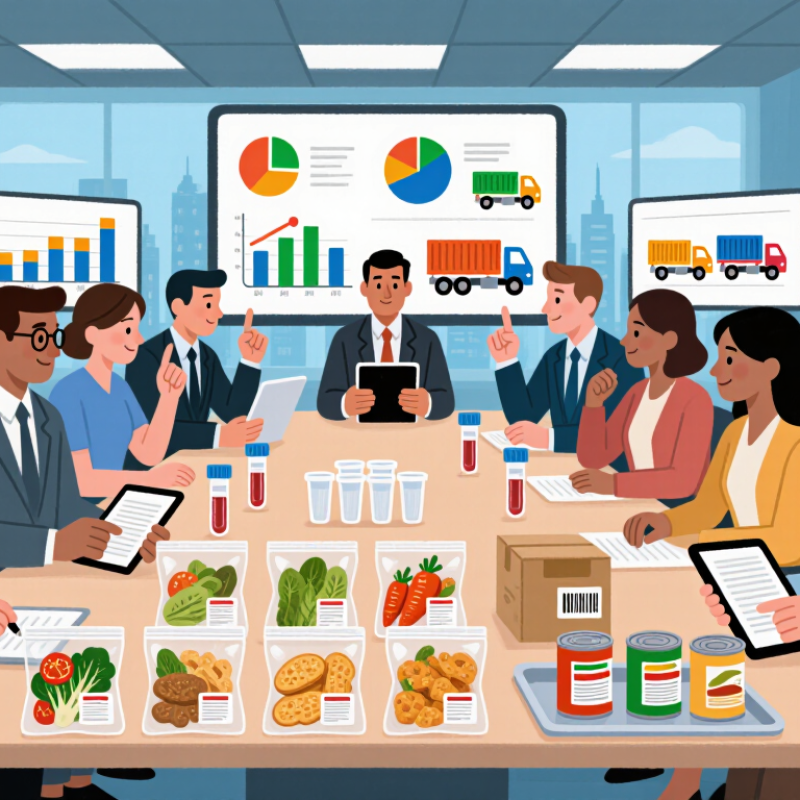
Market fit also deserves close attention. A product designed for European retail may need different labeling, pack sizes, flavors, or storage conditions in Southeast Asia or the Middle East. Experienced procurement teams examine local regulations, consumer habits, logistics capacity, and emergency replenishment plans before signing long-term agreements. They also test samples under realistic conditions, such as humid warehouses, extended transport, or fluctuating temperatures. No supplier will fit every market perfectly. That is a practical limitation, not a reason to ignore the opportunity. Forecasts can fail, costs can shift, and sustainability claims may require deeper evidence. Reliable decisions therefore depend on transparent data, qualified partners, and regular performance reviews. This guide explores how global buyers can evaluate food solutions with professional judgment, responsible sourcing practices, and enough flexibility to respond when real-world conditions change.
Map Global Demand with FAO Food-Price and WTO Trade Data for 2026
Choosing food solutions for global buyers in 2026 starts with measurable demand, not attractive assumptions. The FAO Food Price Index averaged 122.0 points in 2024, falling 2.1% from 2023. That decline does not mean every market became cheaper. Grain, vegetable oil, meat, dairy, and sugar moved differently. Buyers should study each sub-index before setting prices, pack sizes, or sourcing plans.
The WTO World Trade Statistical Review 2024 shows that merchandise trade remains highly connected, but uneven across economies and product groups. For 2026 planning, compare import values, trade volumes, and supplier concentration by destination. A market importing more processed food may need stable shelf life and smaller case quantities. A market exposed to freight disruption may value regional supply and flexible formulations. These are practical signals, not guesses.
I would build a simple dashboard using FAOSTAT prices, the FAO Food Price Index, and WTO trade profiles. Track three years, not one month. Add currency changes, port costs, and seasonal demand. The map will be imperfect. Trade data can lag, and food prices can change quickly. Still, transparent sources create better decisions than intuition alone. Recheck the model every quarter, especially when tariffs, weather, or harvest forecasts shift.
Set Safety Gates Against WHO’s 600M Annual Foodborne-Illness Estimate
How to Choose Food Solutions for Global Buyers in 2026?
The World Health Organization estimates that nearly 600 million people become ill from contaminated food each year. That figure should shape every global purchasing decision. A low price means little if a shipment fails a safety check. Buyers need clear safety gates before approving any supplier or product.
Start with documented hazard analysis, allergen controls, and verified sanitation records. Review production water, storage conditions, and worker hygiene. Ask for recent test results, not recycled certificates. Each lot should carry a traceable code from origin to delivery. Temperature logs matter for chilled foods. So do realistic transport trials. A clean document can still hide a weak process.
Tips: Set rejection limits before negotiations begin. Check whether records match physical conditions during an audit. Keep samples from each lot when practical. Test higher-risk ingredients more often. Require written corrective actions after every failure. Local rules may differ, so qualified regulatory review remains necessary. No checklist is perfect. Buyers should revisit controls after complaints, delays, or supplier changes. That uncomfortable review often reveals gaps before customers do.
Test Climate Fit Using FAO Emissions and Packaging Metrics
How to Choose Food Solutions for Global Buyers in 2026?
Global buyers need more than low prices and stable supply. They need evidence that food solutions fit different climates and transport conditions. A practical climate screen can begin with FAO emissions data. Use it to compare production emissions across food categories and regions. Record the product’s farm stage, processing, storage, and transport impacts. Keep the unit consistent, such as kilograms of CO2 equivalent per kilogram of edible food.
Do not treat one number as truth. FAO datasets provide valuable benchmarks, but local farms and factories may perform differently. Ask suppliers for recent, traceable data. Check whether figures cover seasonal changes, irrigation, refrigeration, and food loss. Our first comparison often looks clean. Real data is usually messier.
Packaging needs its own measurement. Record material weight, recycled content, transport volume, durability, and end-of-life options. Then calculate packaging emissions per kilogram of food delivered, not per package alone. A lighter pack may reduce transport emissions, but it could increase leakage or spoilage. That creates more waste. Measure both risks.
Test one product in a warm market and a cold market. Track temperature exposure, damaged units, shelf life, and discarded food. Compare the results with the FAO emissions baseline and packaging data. A perfect score is unlikely. Buyers should document weak points, revise assumptions, and avoid climate claims that the evidence cannot support.
How to Choose Food Solutions for Global Buyers in 2026?
Test climate fit using food-emission benchmarks and packaging recycling metrics.
Lower food-system emissions generally indicate a stronger climate-fit starting point, while higher packaging recycling rates can support regional circularity goals. Buyers should also verify transport distance, farming practices, portion size, packaging weight, and local collection infrastructure before making a final decision.
Sources: Poore and Nemecek food-system emissions dataset, published via Our World in Data; Eurostat, EU-27 packaging recycling rates by material, 2021. Emissions are measured in kg CO₂e per kg of food. Packaging values are recycling rates (%).